Trade Intelligence
A trade-data dashboard for a Korean seafood importer. It brings Korea Customs Service and MFDS public data onto one screen, combines market signals, risk, and import trends, and pairs them with LLM answers grounded in verified data. I designed and shipped this as a client-commissioned product.
Client context
The client is a domestic seafood importer. Operations staff were living with the reality that Korea Customs monthly trade statistics, MFDS imported-food declaration data, and risk events such as recalls and sales suspensions were scattered across separate public-data sources. Reading the market and risk required opening each source individually, and interpretation depended heavily on whoever was on duty.
The brief was a tool that consolidates public data onto a single screen, makes it faster to read market and risk, and supports decisions with the same evidence regardless of staff turnover. The company name, the client’s own product list, raw source data, and credentials are not published here; the client is anonymized as a Korean seafood importer.
Approach
During requirements I narrowed the product scope to five core questions the team needed to answer every day: recent Korean shrimp import volume, the HS items and origin countries driving volume, monthly average import price movement, the importers and overseas manufacturers that appear in the data, and the public-data connectors that can extend the product next.
I translated these five questions into eight dashboards. Each screen answers one question and the screens are divided so users do not have to cross-reference views. Shrimp-focused HS codes (030616, 030617, 160521, 160529) are the default scope, and the model expands to crab, lobster, sea urchin, octopus, squid, scallops, clam, eel, mackerel, and salmon categories.
Data pipeline
The architecture is not a UI that calls public APIs directly. Each connector normalizes its source data, loads it into a Supabase cache layer, and the dashboard reads the cache. The current production data surfaces are Korea Customs monthly trade statistics, MFDS imported-food declaration records, the MFDS/data.go.kr risk event cache, and the company-provided own-product seed list.
Risk data reads the Supabase cache first, then supplements with checked-in snapshot rows only when they are newer than the source’s latest confirmation date and not duplicates. When Supabase is temporarily unreachable, the dashboard preserves tab accessibility from a checked-in last-known real cache snapshot, not sample data, but a previous real Supabase cache response. Screens display the source confirmation date so freshness is transparent; when that date is stale, the UI warns that a zero recent-30-day count should not be read as “no events.”
Korea Customs air and sea freight costs, KAMIS verified shrimp retail prices, Bank of Korea ECOS USD/KRW monthly average exchange rates, and UN Comtrade monthly HS6 trade are also implemented as verification pipelines. These four sources stay fail-closed and only surface in the AI chat catalog after Supabase migration, source publish, readback verification, and last-known-good snapshot creation are all complete.
Product and features
The eight dashboards each answer one question. The screenshots below show the overview, market-signals, and risk-monitoring screens. Importer and overseas-manufacturer names and own-product identifiers have been redacted for public publishing.
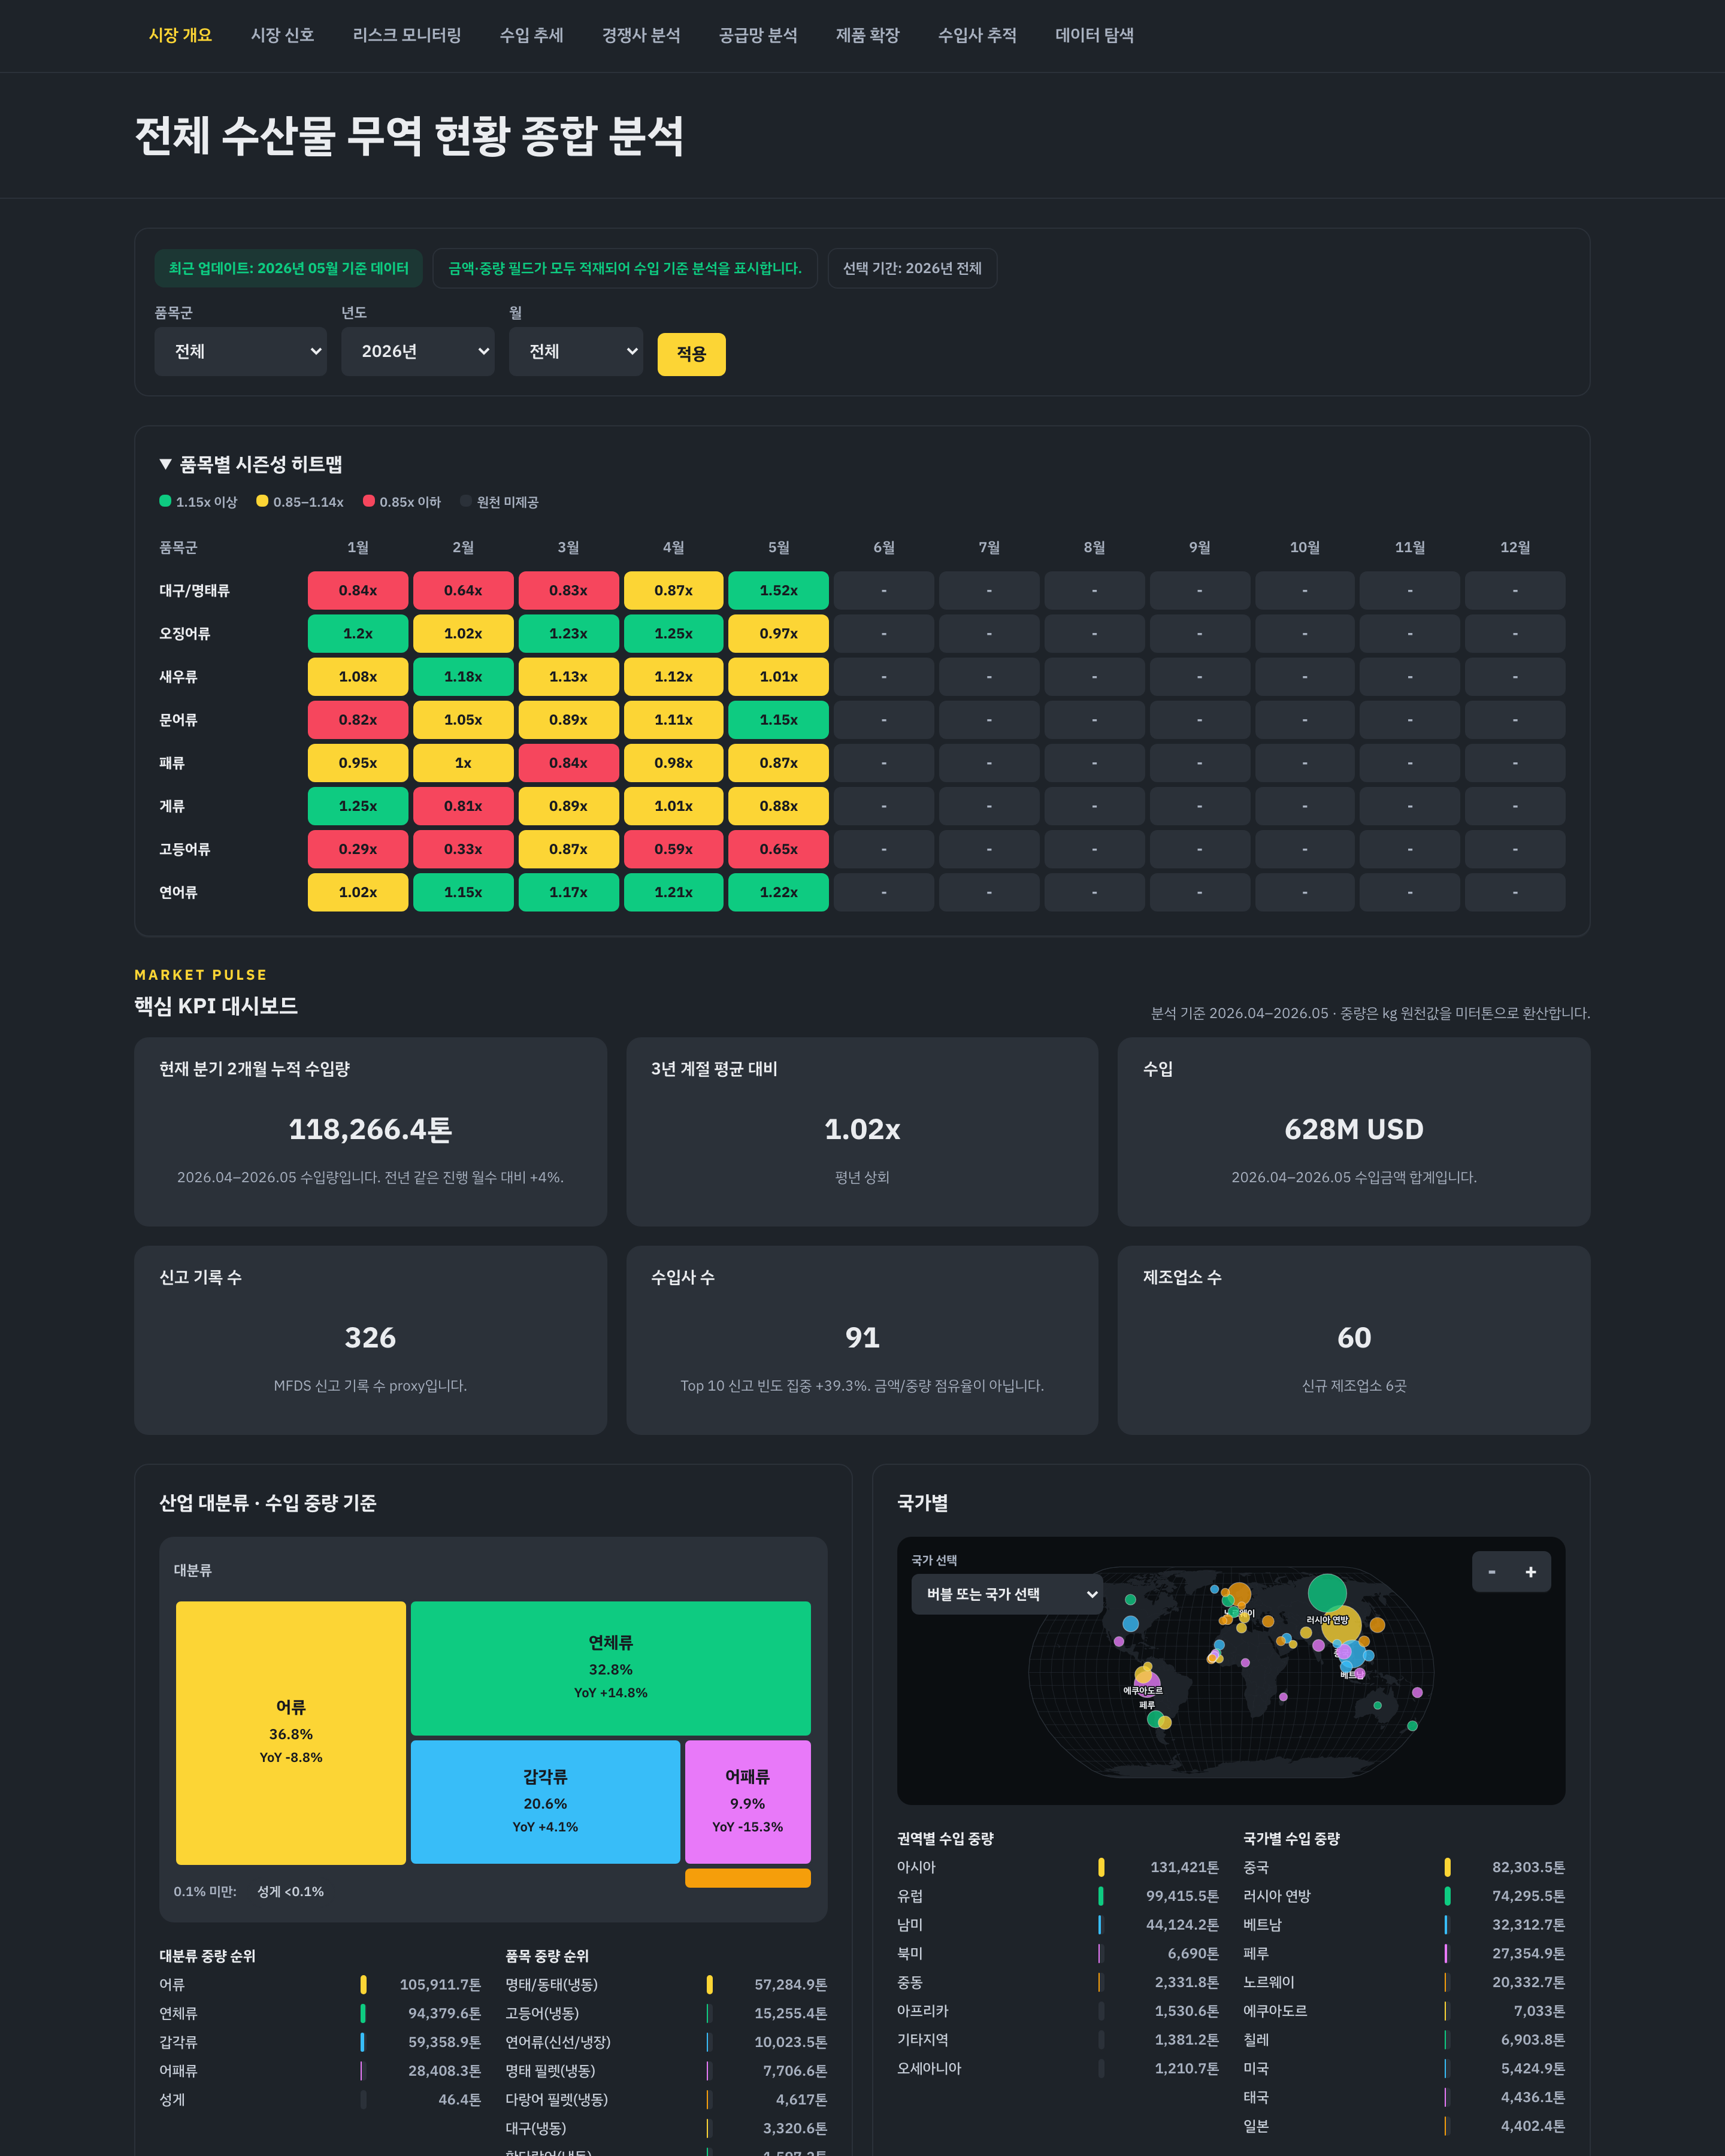
Screen summary
The overview shows the latest data month, the last 3 months of import volume against a 3-year seasonal average index, importer and manufacturer counts, Top 10 concentration, monthly YoY labels, origin comparison, an industry treemap, and an item-level seasonality heatmap. Charts render client-side with AntV G2 and the screens use server rendering where possible.
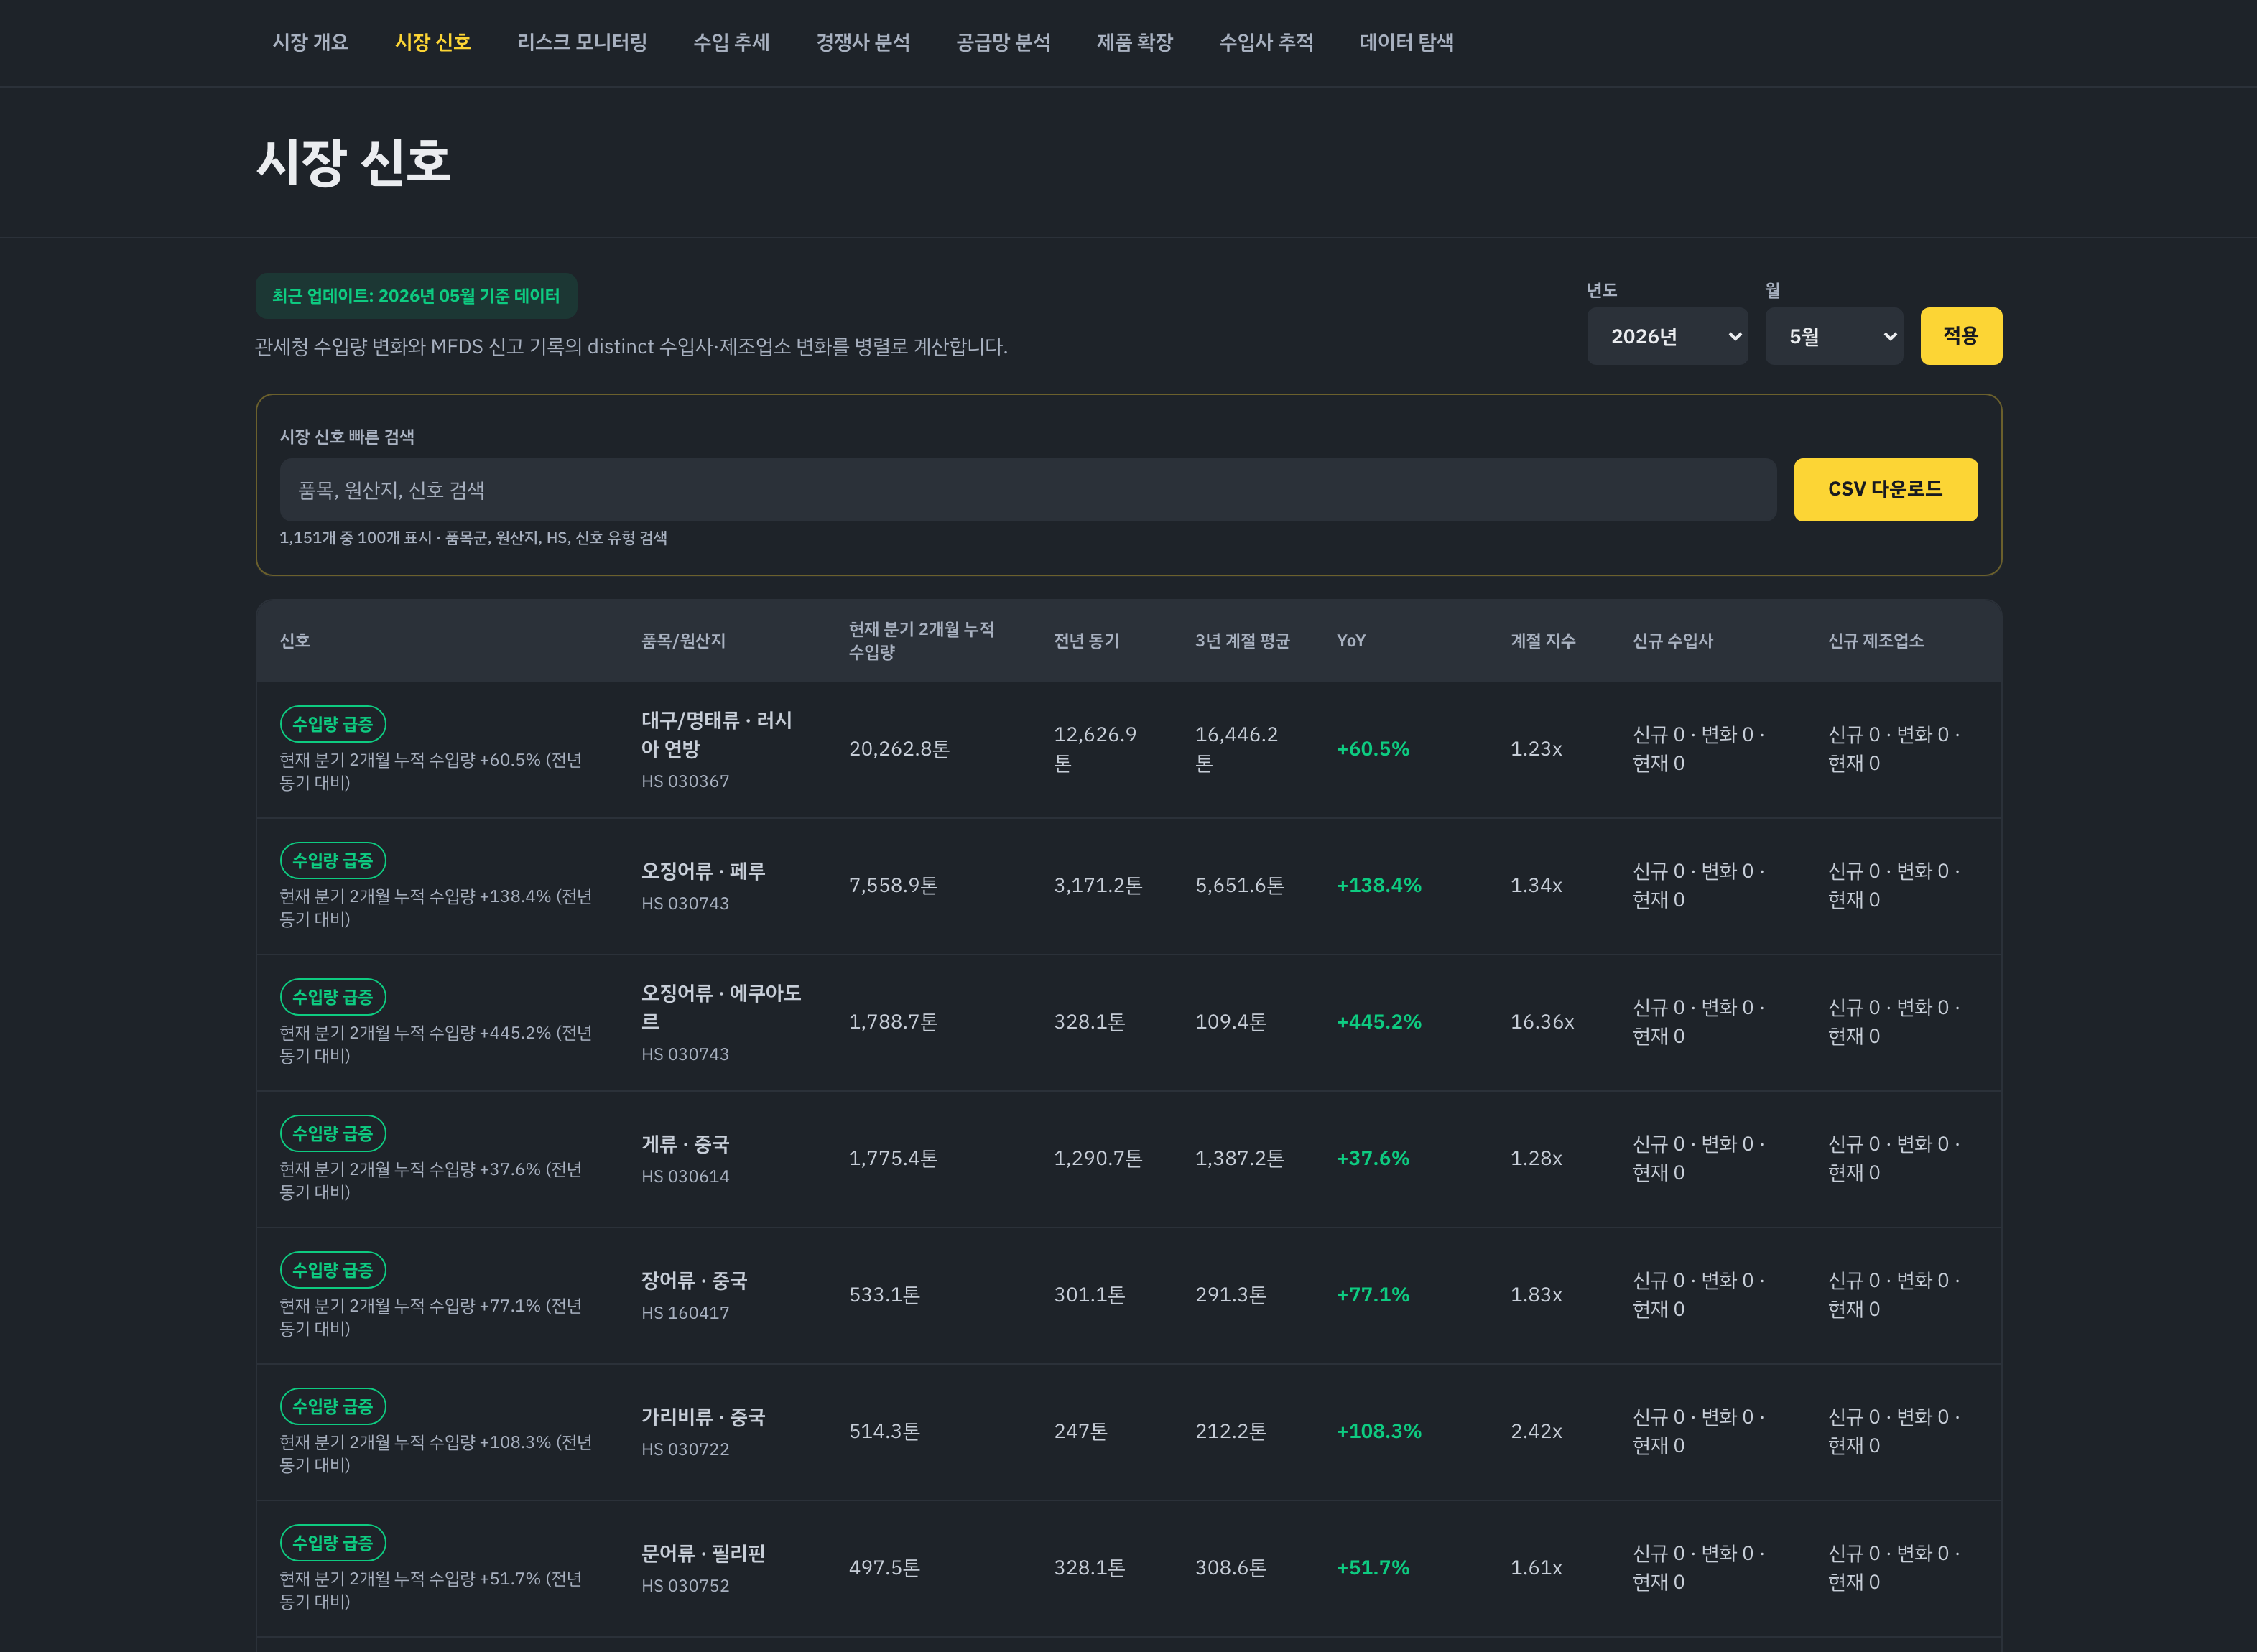
Screen summary
Signal badges, item/origin (+HS), current 3 months, prior year, and 3-year seasonal average are compared in parallel. YoY, seasonal index, importer change, and manufacturer change sit side by side with search, year/month filters, and CSV export. Own-product matching uses the company-provided seed and shows high/medium/review match rationale and specifications. Company and product names are redacted in the screenshot.
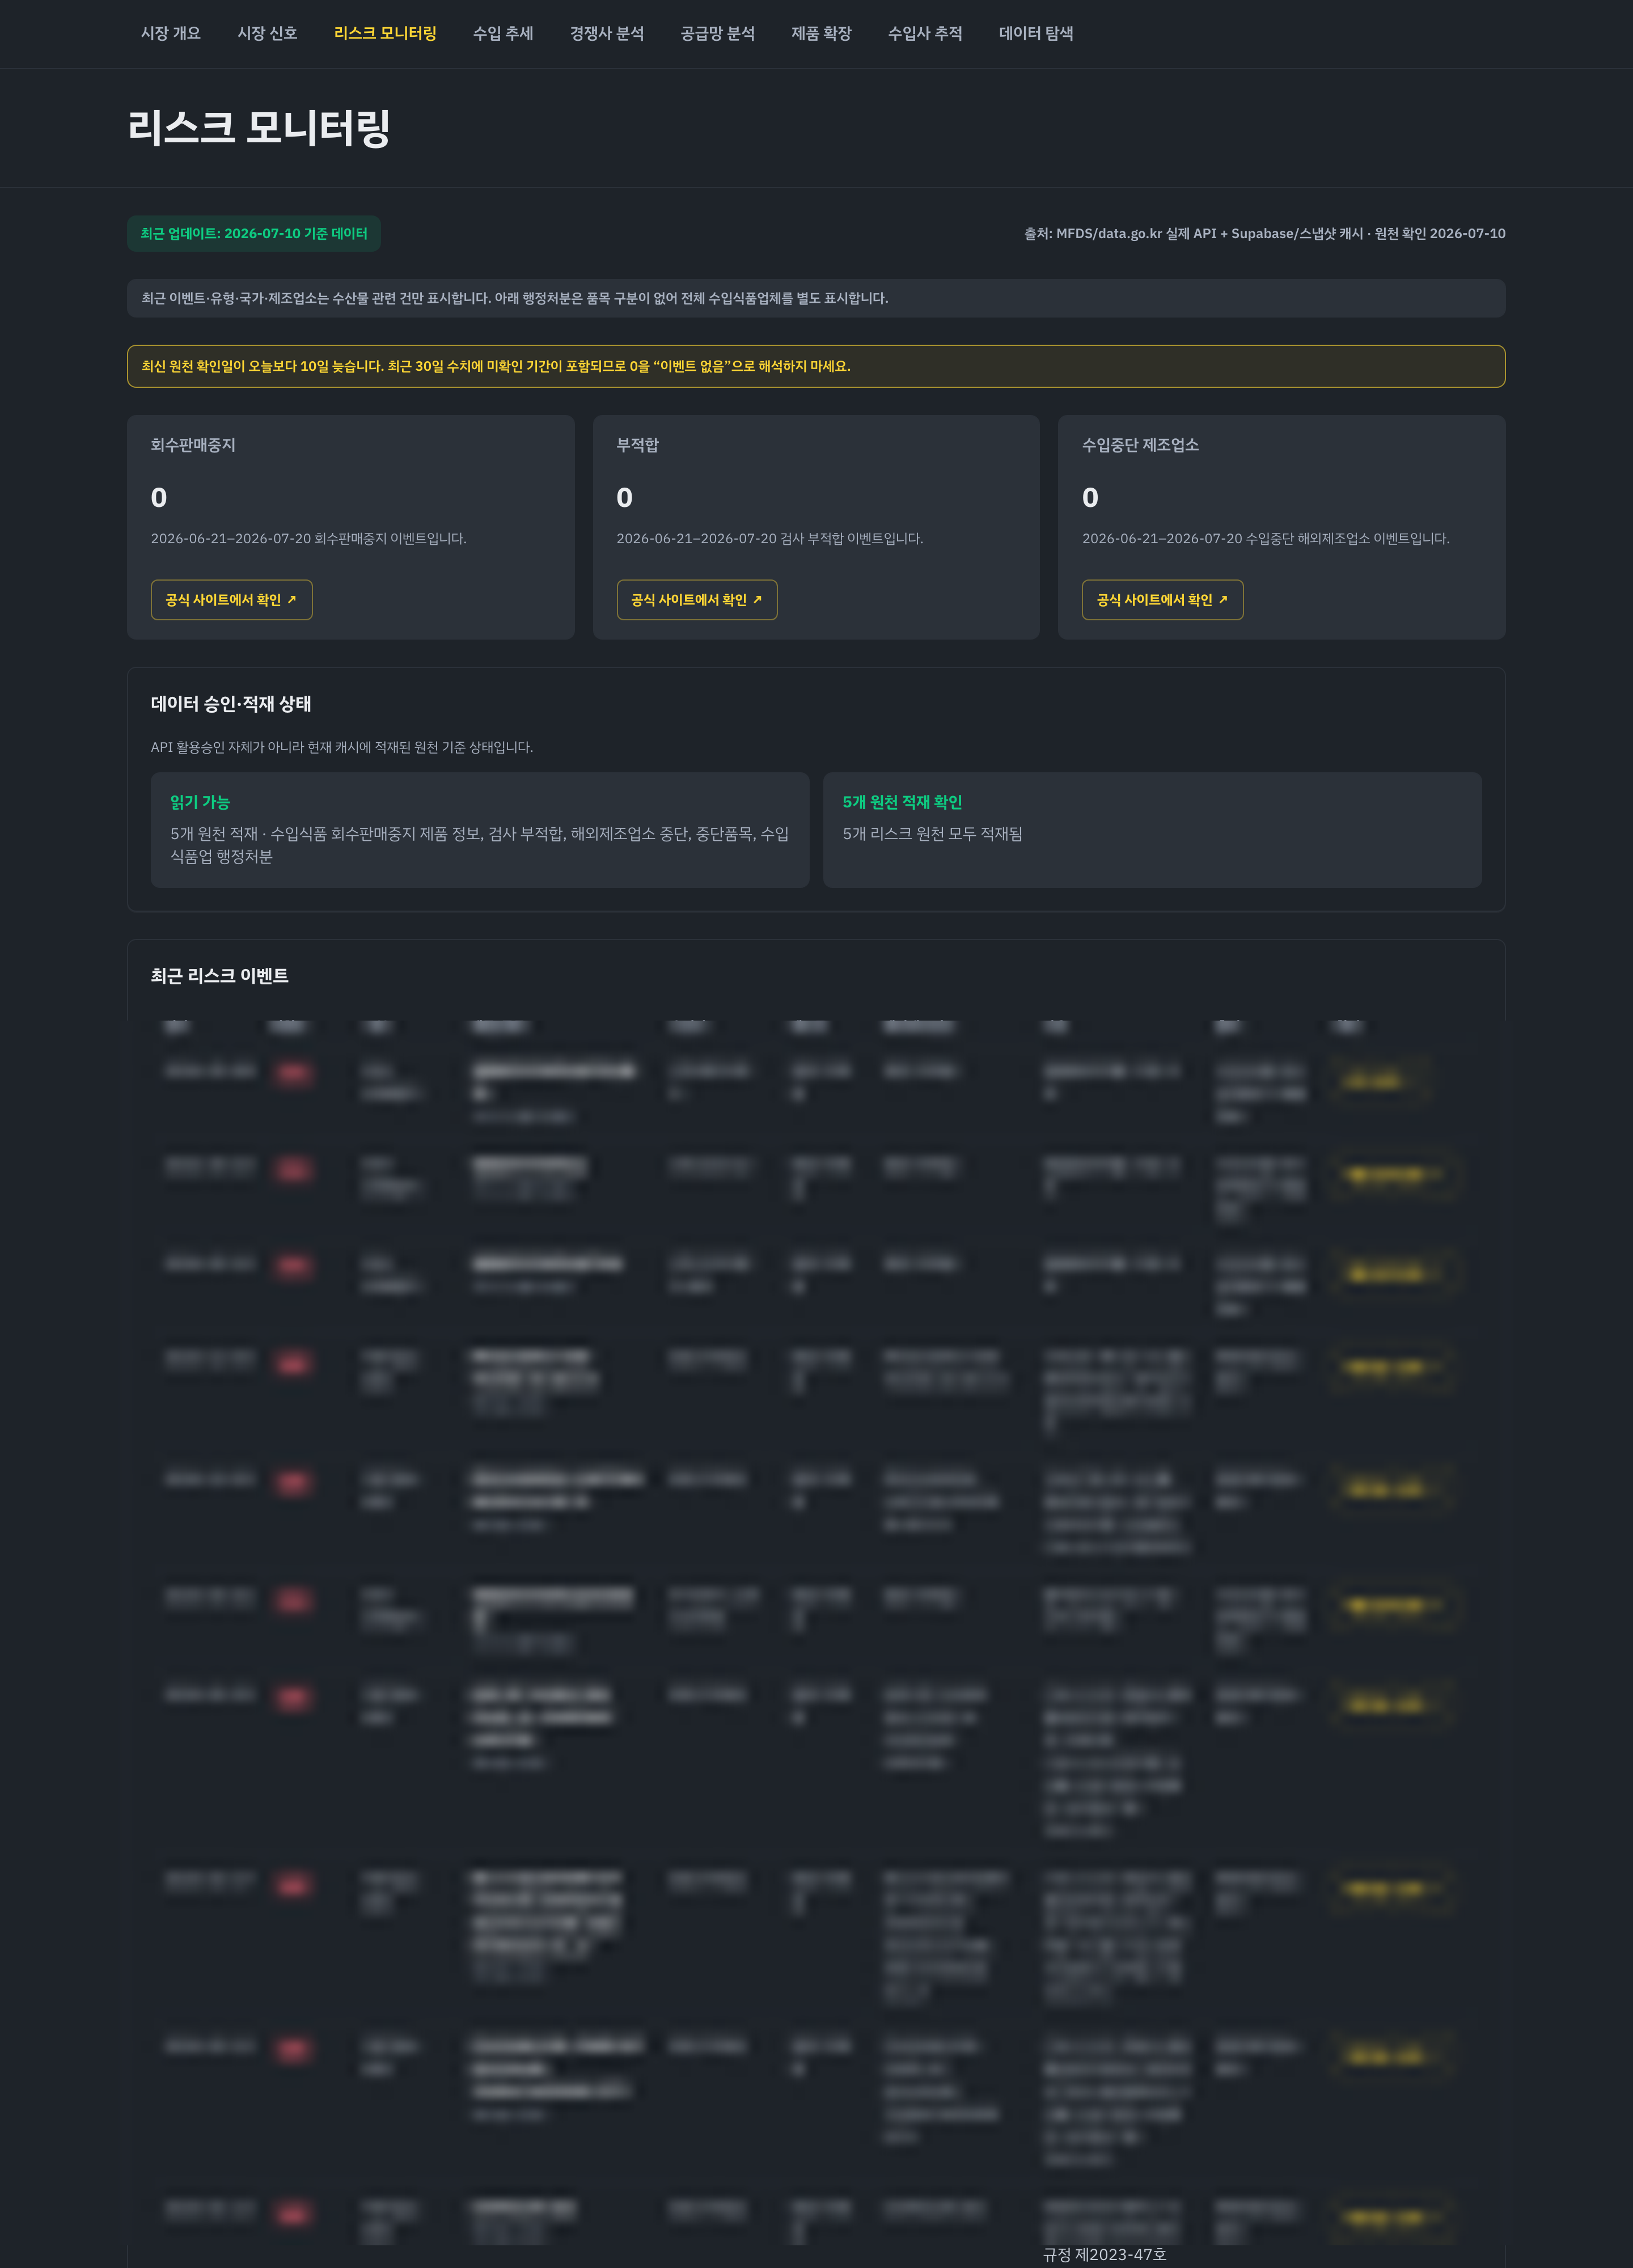
Screen summary
Built from MFDS and data.go.kr events. Recent 30-day manufacturer KPIs, data approval and load state, recent-event tables and mobile cards by country and overseas manufacturer, plus summaries by type, country, and manufacturer. Records with a source identifier link to the official detail page; records without one link to an official search or listing. Administrative actions without item classification are shown at the company level and are not arbitrarily joined to seafood. The screen shows the source confirmation date for freshness transparency. The detailed events table is redacted in this screenshot; only KPI cards and source status are shown publicly.
LLM · RAG
/dashboard/explore interprets a question first as a structured contract, then computes only within the actual observed range of the connected official data. It preserves the exact period, comparison basis, HS item, country, importer, and manufacturer filters, and analyzes Korea Customs monthly trade, MFDS declaration records, and MFDS hazard information in parallel without fake joins.
Every answer carries source, observed range, freshness, supporting row count, calculation method, and limitations. It explicitly refuses out-of-range periods, declaration frequency as market share, and future forecasts where no official projection exists. Unit price is import-value sum ÷ import-weight sum, not the average of row-level averages. Generative Python or model-produced figures are never used as the factual path in user answers.
The RAG index is built by sync:explorer-rag-index, accuracy regression is run by test:explorer-golden, and official source metadata is published by sync:explorer-sources. Hallucination-suppression regression tests ship in the repository.
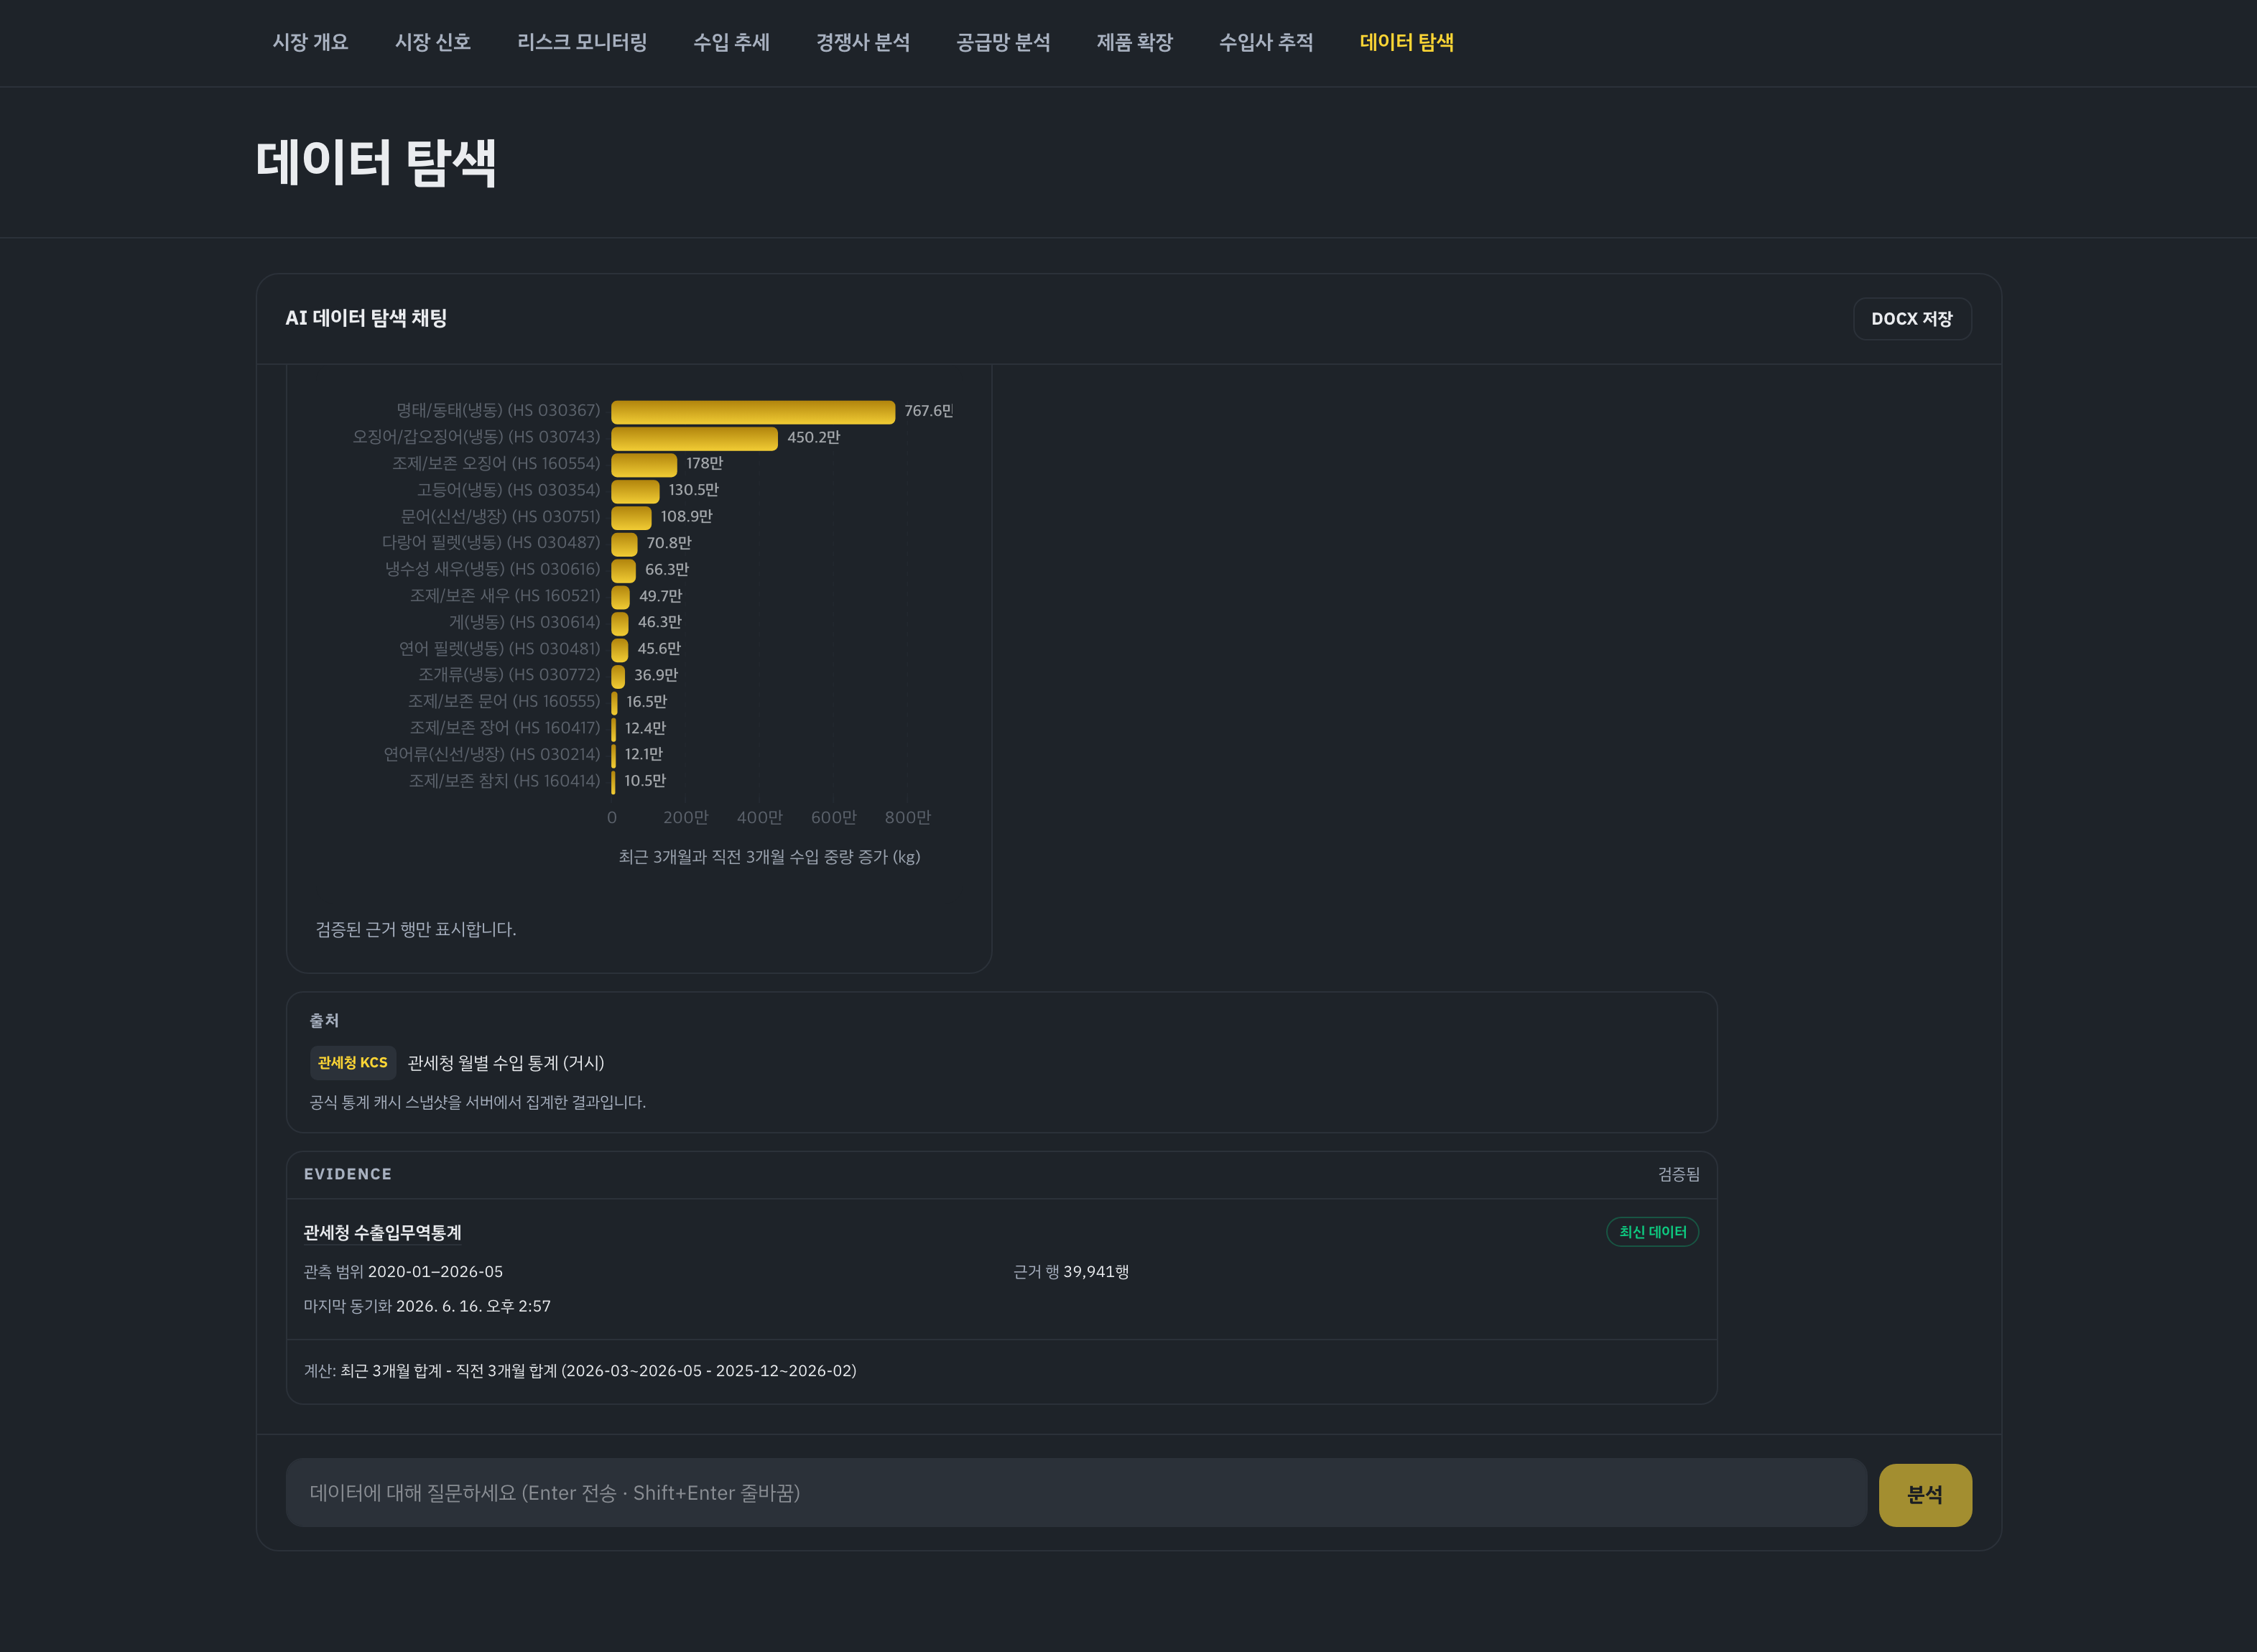
Screen summary
The Explore screen interprets a natural-language question as a structured contract, refuses out-of-range requests, and answers in-range questions with source, supporting row count, and calculation method. Because source, range, and freshness travel with the answer, the operator can verify the evidence immediately. The question and answer in the screenshot are publish-safe examples; importer and manufacturer identifiers have been redacted.
Technical implementation
Next.js App Router, React, TypeScript, and Tailwind CSS. Charts render with AntV G2, maps with d3-geo and topojson-client, and data manipulation with arquero. Supabase serves as the cache layer and Vercel hosts the product. Filter state lives in URL search parameters so any view is shareable and reproducible. Tests run on vitest and Playwright.
8 dashboards
Overview, market signals, risk, import trends, competitor analysis, importer tracking, Explore, and the connector catalog. Each screen answers one question.
Next.js · Supabase · Vercel
App Router server rendering, a Supabase cache layer, and Vercel deployment keep the product operational.
Screens use server rendering where possible and complex charts load AntV G2 on the client. The UI prefers Korean business language the user already knows and avoids exposing raw API field names or internal keys. Auth, organization management, and billing modules exist as SaaS-extension scaffolding, but the current product focuses on dashboard functionality.
My role
I owned the work end-to-end, from requirements through deployment and documentation. I framed the five core questions, divided responsibility by screen, designed the connectors and normalization schemas, the Supabase cache layer, and the fallback snapshot policy. I implemented the eight dashboards and the RAG Explore full-stack and deployed to Vercel. I documented risk, methodology, and data-freshness limitations inside the product itself.
I used AI tools for code, classification, and drafting. Model outputs are treated as things to verify. Raw public-data sources, the client’s own-product list, and credentials are not published in this portfolio. Client identifiers and importer/manufacturer names in the screenshots have been redacted.
Results
A working product is deployed and running on Vercel. Eight dashboard screens each answer one question, and filter state is shareable through URL search parameters so any view can be reproduced. RAG Explore attaches source, observed range, freshness, supporting row count, calculation method, and limitations to every answer. Public-data connectors are modeled in code, and the four verification connectors stay fail-closed until readback verification is complete before they appear in the catalog.
Quantitative claims are limited to facts verifiable from the repository: eight dashboard routes, the deployment URL, URL-shareable filters, and RAG-grounded answers. Private metrics such as user growth, revenue, or time saved are not published here.
Limitations
This is an alpha-stage dashboard prototype. Korea Customs monthly import data must be synced into the Supabase cache for the UI to function, and the UI shows only real cache data. Freshness depends on the source confirmation date; when that date is stale, the UI warns that a zero recent-30-day count should not be read as “no events.”
Own-product matching uses the company-provided seed, and adding new items within a session is for review only. Auth, organization management, and billing have data models and partial logic but are not exposed as full user screens. RAG answers, model outputs, and sampling limitations can affect interpretation.