정성적 데이터에서
고객과 시장의 심리를 읽습니다.
Selected work
Probato
2024년에 시작한 독립 프로젝트입니다. 기업과 제품에 대한 소비자 반응을 현대 도덕 심리학 이론을 바탕으로 정량화하여 의사결정에 바로 쓸 수 있는 근거를 도출합니다.
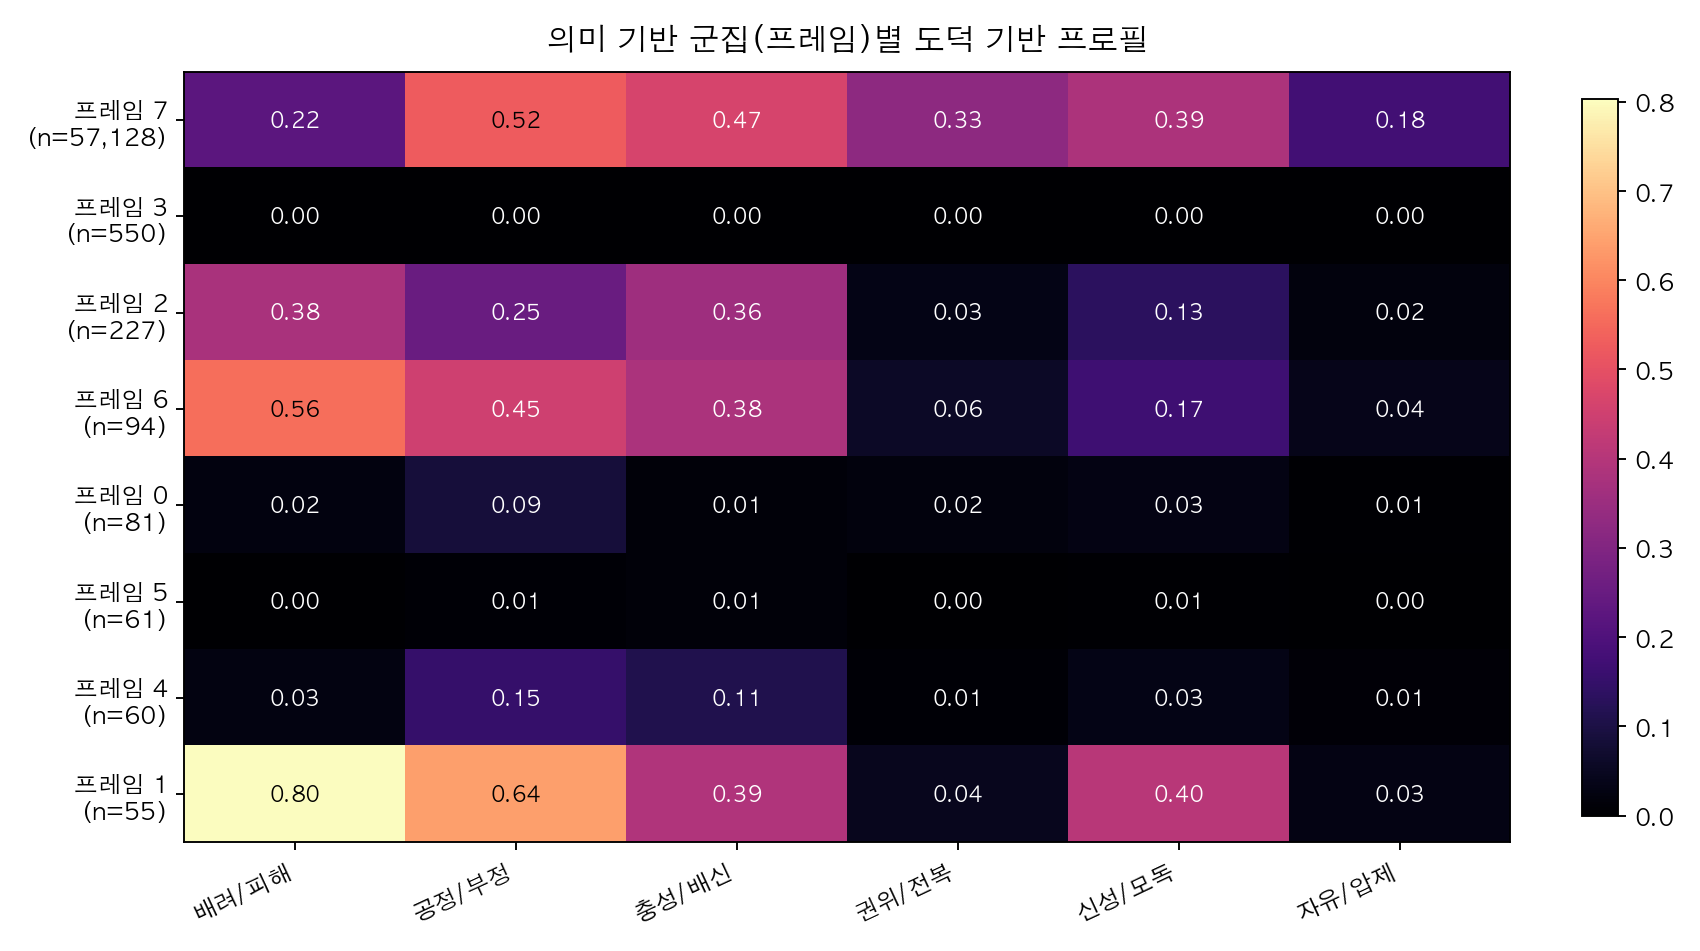
프레임 번호는 순위나 주제명이 아닌 비지도 군집 ID입니다.
프레임 7이 57,128건으로 가장 큰 군집입니다. 이 군집의 평균 신호는 피해 0.22, 공정성 0.52, 배신 0.47, 권위 0.33, 신성성 훼손 0.39, 자유 0.18입니다. 군집 번호 자체에 주제 의미를 부여하지는 않았습니다.
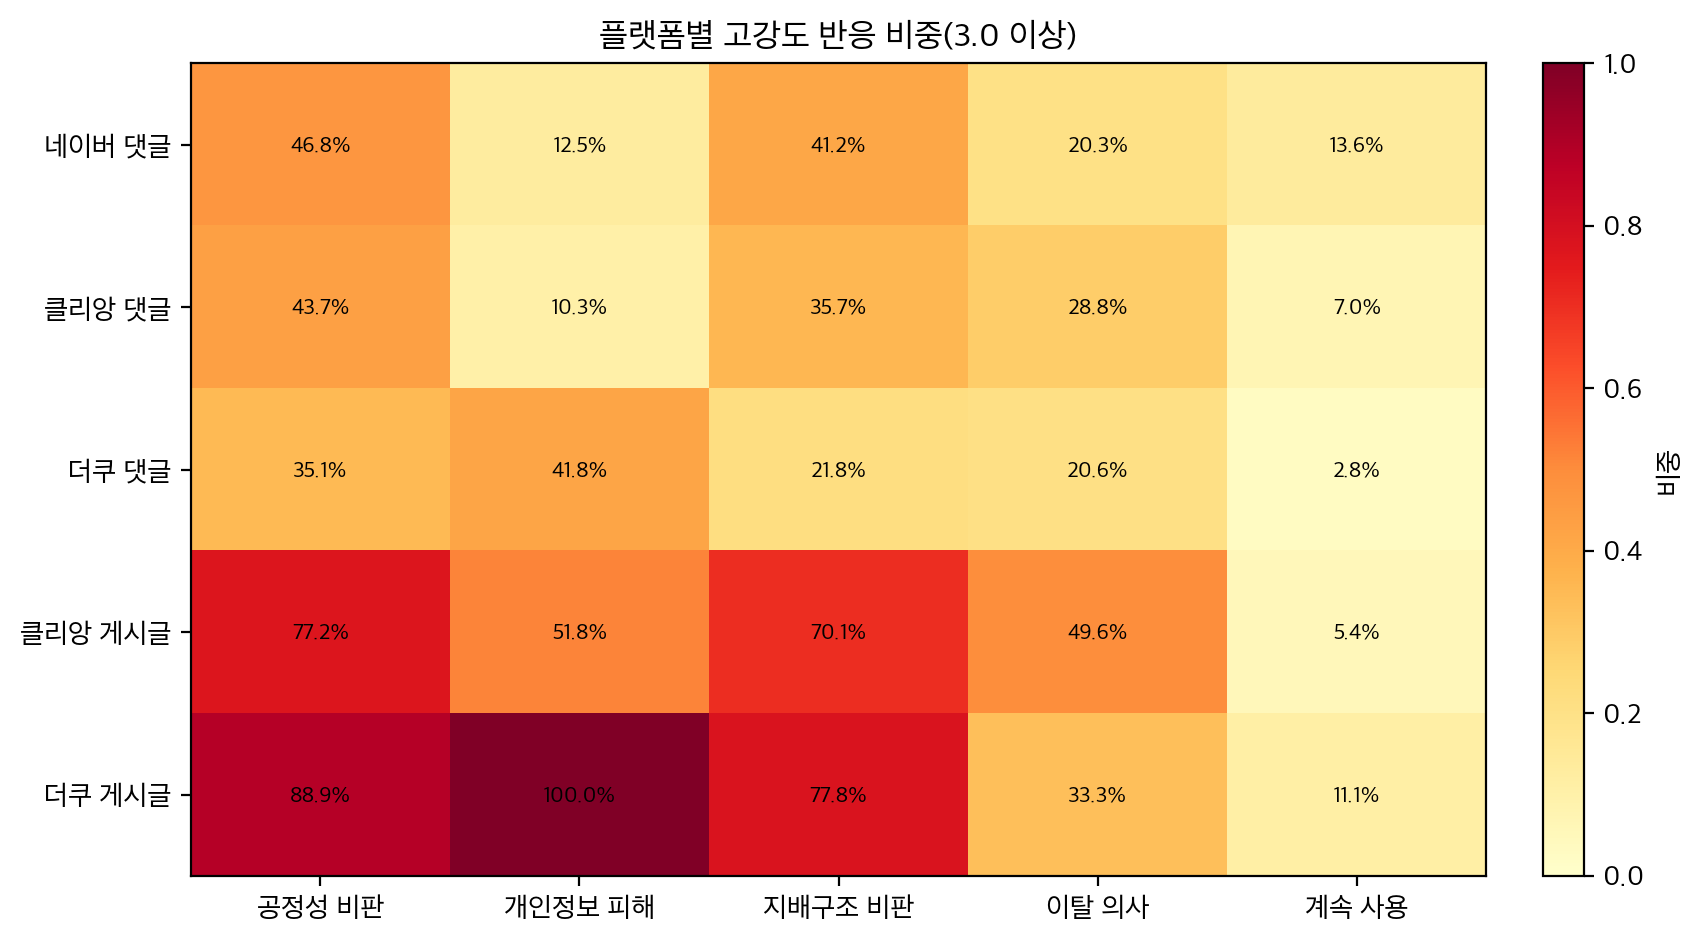
점수 3.0 이상인 고강도 반응의 플랫폼별 비중
네이버 뉴스 댓글에서는 공정성 비판 46.8%, 지배구조 비판 41.2%, 이탈 의사 20.3%로 나타났습니다. 클리앙 댓글에서는 각각 43.7%, 35.7%, 28.8%였습니다. 표본과 표현 방식이 다른 만큼 플랫폼 간 단순 순위로 읽지는 않았습니다.
서울대 MBA Applied Business Project
시장 반응과 온라인 이해관계자 데이터를 조합하여 사이버보안 위기 대응 방안을 비교한 MBA 졸업 프로젝트입니다.
정성적 신호를 의사 결정에 적용하는 방법
Qualitative analysis
반어와 조롱, 입장, 맥락이 뒤섞인 텍스트를 분석 가능한 단위로 풀어냅니다.
Customer psychology
긍정·부정의 방향을 넘어, 반감과 책임 요구를 만들어 내는 심리적 프레임까지 읽습니다.
Data and AI
수집과 스키마 설계, LLM 보조 라벨링, 임베딩, 평가를 재현 가능한 하나의 흐름으로 잇습니다.
Strategy
분석 결과를 대안 비교와 우선순위, 실행 조건과 한계로 정리합니다.
분석과 실행을 함께 다룹니다
윤리 교육, 출판·콘텐츠 편집, MBA, 데이터 분석을 거치며 쌓은 경험을 바탕으로, 고객의 심리를 이해하고 비즈니스 전략을 제안합니다.